
Mohammed Jazara's Science Notebook
Endothermic and Exothermic Reactions
Some chemical reactions absorb energy and are called endothermic reactions. Many chemical reactions give off energy. Chemical reactions that release energy are called exothermic reactions. You will study one endothermic reaction and one exothermic reaction in this experiment.
In Part I, you will study the reaction between citric acid solution and baking soda. An equation for the reaction is
In Part II, you will study the reaction between magnesium metal and hydrochloric acid. An equation for this reaction is
OBJECTIVES
In this experiment, you will
-
Observe two chemical reactions.
-
Use a computer to measure temperature changes.
-
Determine the change in temperature, Dt, for each of the reactions.
-
Identify endothermic and exothermic reactions.
MATERIALS
|
computer |
250 mL beaker |
|
Vernier computer interface |
balance |
|
Logger Pro |
citric acid, H3C6H5O7, solution |
|
Vernier Temperature Probe |
baking soda, NaHCO3 |
|
50 mL graduated cylinder |
hydrochloric acid, HCl, solution |
|
Styrofoam cup |
magnesium, Mg |
PROCEDURE
1. Obtain and wear goggles.
Part I Citric Acid Plus Baking Soda
2. Place a Styrofoam cup into a 250 mL beaker as shown in Figure 1. Measure out 30 mL of citric acid solution into the Styrofoam cup. Place the Temperature Probe into the citric acid solution.
3. Connect the Temperature Probe to the computer interface and set the Data Collection Duration to 12 minutes.
4. Weigh out 10.0 g of solid baking soda on a piece of weighing paper.
5. Note: The Temperature Probe must be in the citric acid solution for at least 45 seconds before this step.
-
Click to begin data collection.
-
After a few temperature readings have been made, add the baking soda to the citric acid solution.
-
Stir the solution to ensure good mixing.
-
Collect data until a minimum temperature has been reached and the temperature readings begin to increase, then click .
6. Take a screen shot of the graph.
7. Dispose of the reaction products as directed by your teacher.
8. Click the Statistics button, . Record the minimum and maximum temperatures.
Part II Hydrochloric Acid Plus Magnesium
9. Measure out 30 mL of HCl solution into the Styrofoam cup. CAUTION: Handle this acid with care. It can cause painful burns if it comes in contact with your skin or gets into your eyes. Place the temperature probe into the HCl solution.
10. Note: The Temperature Probe must be in the HCl solution for at least 45 seconds before this step.
-
Click to begin data collection.
-
After a few temperature readings have been made, add the Mg to the HCl solution.
-
Stir the solution to ensure good mixing. CAUTION: Do not breathe the vapors!
-
Collect data until a maximum temperature has been reached and the temperature readings begin to decrease, then click.
11. Take a screen shot of the graph.
12. Dispose of the reaction products as directed by your teacher.
13. Click the Statistics button, . Record the minimum and maximum temperatures.
14. Write group member names on a piece of paper and leave it in the tray. Move tray to the counter by the sink.
DATA
Part I Part II
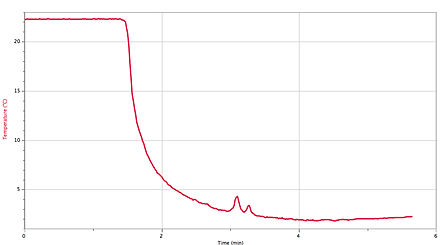
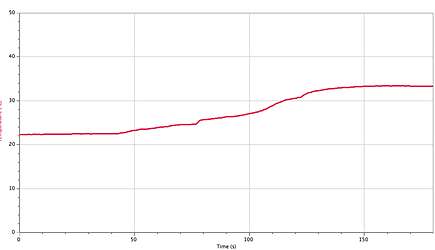
Minimum temperature 1.864 °C 22.34°C
Maximum temperature 22.34°C 33.40 °C
Temperature Graph for Part 1:
Temperature Graph for Part 2:
ANALYSIS
1. Calculate the temperature change, Dt, for each reaction by subtracting the minimum temperature from the maximum temperature (Dt = tmax – t min).
Part 1: 20.476 °C
Part 2: 11.06°C
2. Tell which reaction is endothermic. Tell which reaction is exothermic. Explain.
The first expirement was endothermic because the change in H was greater than zero and the second experiment was less than zero
3. For each reaction, describe three ways you could tell a chemical reaction was happening.
For both Part 1 and Part 2, it changed in temperature, formation and released gases
4. List three important exothermic reactions you have seen. List one endothermic reaction you know.
- Releases heat
CONCLUSION
The first graph shows an endothermic reaction! The second graph shows an exothermic reaction because it is realising energy and got cooler. In both experiments the temperature changed from cool to warm or from warm to cool.
Endothermic and Exothermic Reactions
